Data Visualization: Telling Stories with Data
Posted on September 22, 2024 | Visualization
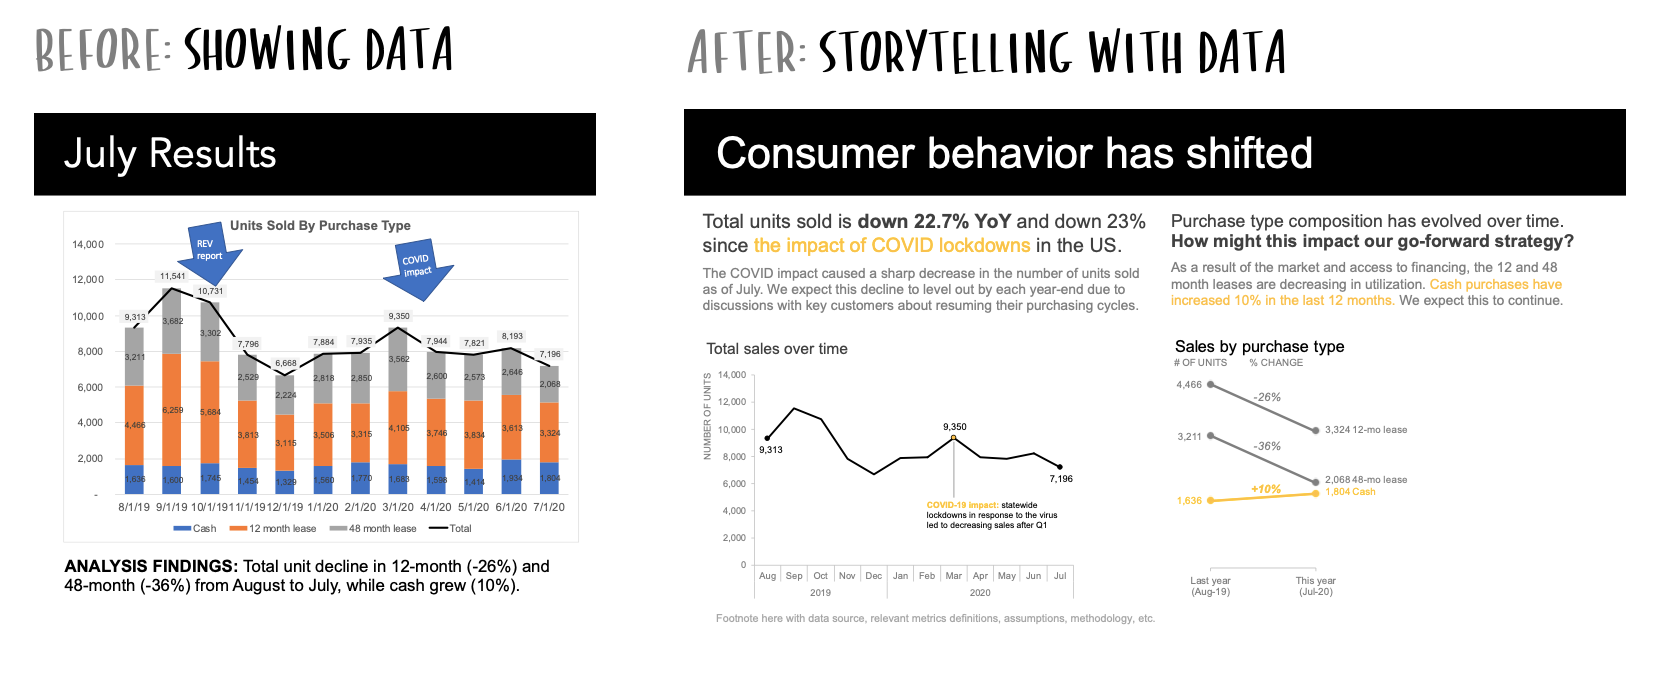
Unlock the power of data visualization! Learn various techniques and tools that can help you present complex data in an engaging and comprehensible way. Transform your insights into visual stories that resonate with your audience.
Why is Data Visualization Important?
Data visualization is a crucial aspect of data analysis. It helps to make complex data more accessible, understandable, and usable. By presenting data visually, you can quickly identify patterns, trends, and insights that may not be apparent in raw data.
Techniques of Data Visualization
- Charts: Use bar charts, line charts, pie charts, and more to represent data visually.
- Infographics: Combine visuals and text to tell a compelling story.
- Dashboards: Provide a real-time view of key performance indicators (KPIs) and metrics.
Tools for Data Visualization
There are various tools available for creating data visualizations, including:
- Tableau: A powerful tool for creating interactive and shareable dashboards.
- Microsoft Power BI: Business analytics service that provides interactive visualizations.
- Matplotlib & Seaborn: Python libraries for creating static, animated, and interactive visualizations in Python.
Conclusion
In a world driven by data, mastering the art of data visualization is essential. It allows you to convey your findings effectively and engage your audience in meaningful ways.